|
Feb 13, 2026 |
Allegheny Technologies (NYSE: ATI)$139.81 USD ( As of 02/12/26 ) |
|
|||||||||||||
Data Overview
| Target Price | $160.00 |
|---|---|
| 52 Week High-Low | $138.72 - $41.97 |
| 20 Day Average Volume | 1,980,779 |
| Beta | 1.02 |
| Market Cap | 18.85 B |
| Dividend / Div Yld | $0.00 / 0.00% |
| Industry | Aerospace - Defense Equipment |
| Industry Rank | 57 / 243 (Top 23%) |
| Current Ratio | 2.66 |
| Debt/Capital | 47.27% |
| Net Margin | 8.81% |
| Price/Book (P/B) | 9.83 |
| Price/Cash Flow (P/CF) | 30.00 |
| Earnings Yield | 2.97% |
| Debt/Equity | 0.90 |
| Value Score | |
|---|---|
| P/E (F1) | 33.69 |
| P/E (F1) Rel to Industry | 1.12 |
| PEG Ratio | 1.42 |
| P/S (F1) | 4.11 |
| P/S (TTM) | 4.11 |
| P/CFO | 30.00 |
| P/CFO Rel to Industry | 0.97 |
| EV/EBITDA Annual | 25.54 |
| Growth Score | |
|---|---|
| Proj. EPS Growth (F1/F0) | 27.10% |
| Hist. EPS Growth (Q0/Q-1) | 58.04% |
| Qtr CFO Growth | 70.35 |
| 2 Yr CFO Growth | 56.41 |
| Return on Equity (ROE) | 24.26% |
| (NI - CFO) / Total Assets | -0.72 |
| Asset Turnover | 0.90 |
| Momentum Score | |
|---|---|
| 1 week Volume change | 10.78% |
| 1 week Price Cng Rel to Industry | 8.80% |
| (F1) EPS Est 1 week change | 2.47% |
| (F1) EPS Est 4 week change | 5.23% |
| (F1) EPS Est 12 week change | 5.34% |
| (Q1) EPS Est 1 week change | 3.55% |
Summary
Earnings estimates for Allegheny for the second quarter of 2020 have been going down over the past month. The company is likely to benefit from strength in the AA&S segment and its joint venture with Tsingshan. Allegheny is also strengthening its efforts to improve cost structure. The company’s cost reduction actions should lend support to its bottom line in 2020. However, the ongoing section 232 tariffs on A&T Stainless joint venture and the impacts of the coronavirus are exerting pressure on the company’s profitability. Lower demand in aerospace and consumer electronics markets is also exerting pressure on the company’s margins. Allegheny is also facing challenges in HPMC segment. The company’s high debt level is another concern. It has also underperformed the industry in the past year.
Elements of the Zacks Rank
Agreement Estimate Revisions (60 days)
|
100% Q1 (Current Qtr)Revisions: 2 Up: 2 Down: 0 |
100% Q2 (Next Qtr)Revisions: 2 Up: 2 Down: 0 |
100% F1 (Current Year)Revisions: 3 Up: 3 Down: 0 |
100% F2 (Next Year)Revisions: 3 Up: 3 Down: 0 |
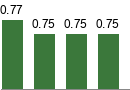
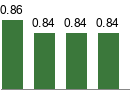
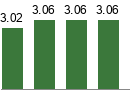
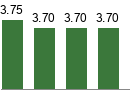
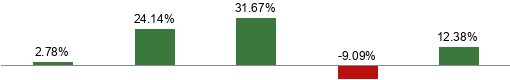
Magnitude Consensus Estimate Trend (60 days)
|
||||||||||
|
||||||||||
|
||||||||||
|
||||||||||
Upside Zacks Consensus Estimate vs. Most Accurate Estimate
|
|
|
|
|
Surprise Reported Earnings History
|
|
|
|
Average 4 Qtr Surprise |
||||||||||||||||||||||||
The data on the front page and all the charts in the report represent market data as of 02/12/26, while the report's text is as of 07/08/2020
Overview


Pittsburgh, PA-based Allegheny Technologies Inc. is a diversified specialty materials producer. The company was created in November 1999 when Allegheny Teledyne spun out Teledyne Technologies and Water Pik Technologies into standalone companies.
Allegheny originally had three main business segments: Flat-Rolled Products, High Performance Metals and Engineered Products. However, the company, in October 2013, announced the restructuring of its Engineered Products segment.
The restructuring includes the integration of the specialty steel forgings business into ATI Ladish’s forgings operations in the High Performance Metals and Components division and the integration of the precision titanium and specialty alloy flat-rolled finishing business into ATI Allegheny Ludlum’s specialty plate business in the Flat-Rolled Products segment. Other businesses that comprised the Engineered Products division have been classified as discontinued operations and include the tungsten materials business and the iron castings and fabricated components businesses.
Allegheny, on Nov 4, 2013, completed the sale of its tungsten materials business to Latrobe, PA-based wear-resistant products company Kennametal Inc. (KMT) for $605 million.
Allegheny’s Flat-Rolled Products (FRP) segment (42% of 2019 sales) produces and distributes stainless steel, nickel-based alloys, titanium and titanium-based alloys, and specialty alloys in various product forms - plates, sheets, engineered strips and precision rolled strip products, as well as grain-oriented electrical steel sheets - to independent service centers and end-use customers. The segment caters to various end markets including oil & gas, automotive, chemical and hydrocarbon processing.
Allegheny’s High Performance Metals and Components (HPMC) segment (58%) produces and distributes high performance alloys including nickel and cobalt-based alloys and super alloys; titanium and titanium-based alloys; exotic metals and their related alloys; and other specialty alloys primarily in long product forms. The segment mainly serves the aerospace & defense markets and nearly half of the sales are from products for commercial jet engines.

Reasons To Buy:
Allegheny should benefit from strength in the AA&S segment, its joint venture with Tsingshan and efforts to improve cost structure.
Allegheny benefited from strength in the Advanced Alloys & Solutions (“AA&S”) unit in the last reported quarter. Notably, revenues in the AA&S division were $535.2 million, up 5.3% from the prior-year quarter’s levels. Higher HRPF conversion services billings as well as the defense markets supported the unit’s sales. The segment’s operating profit totaled $24.1 million, up 141% year over year. Margins benefitted from improved results from the STAL joint venture and higher surcharges on raw materials. The momentum is likely to continue in the second quarter.
Allegheny continues to improve its cost structure with its gross cost reduction initiative. The company has identified and deployed capturing $110-$135 million in incremental cost reductions in 2020. Allegheny is implementing a temporary cut in salaries of roughly 12%. Further, the company is lowering or deferring 401(k) benefits for its participating employees. Additionally, the company is substantially curtailing capital expenditures and lowering inventories. The company also generated nearly $460 million in free cash flow for 2019, marking a 60% improvement year over year. Notably, free cash flow for 2020 is projected in the range of $110-$140 million. The company expects to generate free cash flow from ongoing operational improvements, anticipated financial performance and disciplined spending.
Allegheny is in the process of finishing several self-funded capital projects, some of which have already been completed, to help augment organic growth and its cost structure. The company’s $1.2 billion Hot-Rolling and Processing Facility (HRPF) is now fully integrated into daily operations and is producing high-value and standard flat rolled products in wider, longer and thinner coils. The HRPF facility is expected to significantly boost capabilities of the FRP division. Allegheny’s innovative joint venture (JV) with Tsingshan Group Company will help to utilize HRPF and its previously idled Direct Roll Anneal and Pickle (DRAP) line in Midland, PA. The company has signed the first significant HRPF-enabled carbon steel conversion agreement with NLMK USA. The agreement will open up an additional growth opportunity of 15-20% in HRPF utilization.
Reasons To Sell:
Impacts of the coronavirus are putting pressure on the company’s performance. High debt level is another worry. Sluggish demand in the aerospace market is another concern.
Allegheny's shares have underperformed the industry it belongs to in the past year. The stock fell 60.2% over this period compared with the industry's 53.8% decline. Factors such as the ongoing section 232 tariffs on A&T Stainless joint venture and the impacts of the coronavirus are weighing on the company’s profitability. Lower demand for oil & gas related products are expected to impact the company’s performance in the future. Also, the company expects demand for consumer electronics to be weak in the second quarter of 2020.
The company is facing challenges in High Performance Materials & Components (HPMC) segment. In the last reported quarter, sales from the segment fell 15.4% year over year to $420.3 million. This was due to lower demand in the aerospace markets. Persistent lower demand may continue to exert pressure on this business in the second quarter of 2020. Moving forward, the company expects commercial aerospace shipments to continue to decline significantly and steadily throughout 2020.
The company's high debt level is a concern. At the end of the first quarter of 2020, its total long-term debt was $1,390 million, essentially flat with the prior quarter’s figure. Moreover, its total debt-to-total capital stood at 43.7% as of Mar 31, 2020, higher than 38.9% as of Dec 31, 2019 and also above its industry’s 41.1%. As such, the company appears to have higher default risk.
Last Earnings Report
Quarter Ending 12/2025
| Report Date | Feb 03, 2026 |
|---|---|
| Sales Surprise | -1.72% |
| EPS Surprise | 4.49% |
| Quarterly EPS | 0.93 |
| Annual EPS (TTM) | 3.24 |
Allegheny Tops Earnings and Revenue Estimates in Q1
Allegheny recorded net income of $21.1 million or 16 cents per share in first-quarter 2020, up from $15 million or 12 cents per share in the prior-year quarter.
Excluding one-time items, adjusted earnings per share were 20 cents that beat the Zacks Consensus Estimate of 13 cents.
The company delivered revenues of $955.5 million in the quarter, down 4.9% year over year. Nevertheless, the figure surpassed the Zacks Consensus Estimate of $913 million.
Segment Highlights
In the first quarter, revenues in the High Performance Materials & Components (“HPMC”) segment declined 15.4% year over year to $420.3 million. The company noted that 85% of unit sales were attributable to the aerospace and defense markets. Also, sales of next-generation jet engine products contributed 50% to total HPMC jet engine product sales. Operating profit in the unit rose 10.4% year over year to $57.1 million.
The Advanced Alloys & Solutions (“AA&S”) segment’s sales rose 5.3% year over year to $535.2 million. Per the company, higher HRPF conversion services billings as well as the aerospace and defense markets supported the unit’s sales. Operating profit in the division totaled $24.1 million, which rose 141% year over year. Margins benefitted from improved results from the STAL joint venture and higher surcharges on raw materials.
Financial Position
Allegheny ended the quarter with cash and cash equivalents of $639 million, up 294.5% year over year. Long-term debt fell 9.5% year over year at $1,390 million.
Net cash used in operating activities for the first quarter was $115.4 million.
Outlook
The company withdrew its guidance for 2020 due to uncertainties created by the coronavirus outbreak. Going forward, it expects challenging and uncertain economic conditions to sustain due to the impacts of the coronavirus on the global aerospace industry.
Recent News
Allegheny Prices Convertible Notes Offering Due 2025 - Jun 17, 2020
Allegheny has priced $285 million total principal amount of 3.5% convertible senior notes due 2025 to qualified institutional buyers in a private placement, pursuant to Rule 144A under the Securities Act of 1933. The company has also granted the initial purchasers with a 13-day option to buy up to an additional $40 million total principal amount of the notes.
The company expects the sale of notes to close on Jun 22, 2020, which is subject to customary closing conditions. Allegheny is expected to receive around $276.3 million in net proceeds from the transaction.
Further, the notes will be senior, unsecured obligations of the company. Interest on the notes are payable semi-annually in arrears on Jun 15 and Dec 15 each year, starting Dec 15, 2020. Unless converted earlier, redeemed or repurchased earlier, the notes will mature on Jun 15, 2025.
Allegheny intends to use around $222.3 million of the net proceeds to repurchase roughly $203.2 million total principal amount of its outstanding 4.75% convertible senior notes due 2022. The company also expects to use around $19 million of the net proceeds to pay the cost of the capped call transactions and the remainder for general corporate purposes.
Valuation
Allegheny’s shares are down 52.4% in the year-to-date period and down 60.2% over the trailing 12-month period. Stocks in the Zacks Steel - Speciality industry and Zacks Basic Materials sector are down 50.2% and 6% in the year-to-date period, respectively. Over the past year, the Zacks sub-industry and sector are down 53.8% and 2.5%, respectively.
The S&P 500 index is down 1.1% in the year-to-date period and up 7.3% in the past year.
The stock is currently trading at 0.57X trailing 12-month tangible book value, which compares to 0.8X for the Zacks sub-industry, 2.28X for the Zacks sector and 4.45X for the S&P 500 index.
Over the past five years, the stock has traded as high as 2.03X and as low as 0.3X, with a 5-year median of 1.25X.
Our Neutral recommendation indicates that the stock will perform in-line with the market. Our $10 price target reflects 0.58X tangible book value.
The table below shows summary valuation data for ATI:
.jpg)
Industry Analysis(1)Zacks Industry Rank: NA

Top Peers
| Heico Corporation (HEI) |
|
| Heico Corporation (HEI.A) |
|
| Moog Inc. (MOG.A) |
|
| Woodward, Inc. (WWD) |
|
| Curtiss-Wright Corporation (CW) |
|
| CAE Inc (CAE) |
|
| Leonardo DRS, Inc. (DRS) |
|
| Teledyne Technologies Incorporated (TDY) |
|
| AAR Corp. (AIR) |
|
Industry Comparison Aerospace - Defense Equipment | Position in Industry: 1 of 36 |
Industry Peers |
| ATI |
|
|---|---|
| Market Cap | 18.85 B |
| # of Analysts | 4 |
| Dividend Yield | 0.00% |
| Value Score | |
| Cash/Price | 0.02 |
| EV/EBITDA | 25.54 |
| PEG Ratio | 1.42 |
| Price/Book (P/B) | 9.83 |
| Price/Cash Flow (P/CF) | 30.00 |
| P/E (F1) | 33.69 |
| Price/Sales (P/S) | 4.11 |
| Earnings Yield | 2.97% |
| Debt/Equity | 0.90 |
| Cash Flow ($/share) | 4.62 |
| Growth Score | |
| Hist. EPS Growth (3-5 yrs) | 58.04% |
| Proj. EPS Growth (F1/F0) | 27.10% |
| Curr. Cash Flow Growth | 24.03% |
| Hist. Cash Flow Growth (3-5 yrs) | 51.81% |
| Current Ratio | 2.66 |
| Debt/Capital | 47.27% |
| Net Margin | 8.81% |
| Return on Equity | 24.26% |
| Sales/Assets | 0.90 |
| Proj. Sales Growth (F1/F0) | 8.22% |
| Momentum Score | |
| Daily Price Chg | 1.23% |
| 1 Week Price Chg | 8.80% |
| 4 Week Price Chg | 12.56% |
| 12 Week Price Chg | 41.38% |
| 52 Week Price Chg | 128.23% |
| 20 Day Average Volume | 1,980,779 |
| (F1) EPS Est Wkly Chg | 1.10% |
| (F1) EPS Est Mthly Chg | 5.23% |
| (F1) EPS Est Qtrly Chg | 6.67% |
| (Q1) EPS Est Mthly Chg | 3.55% |
| X Industry | S&P 500 |
|---|---|
| 10.15 B | 40.82 B |
| 3 | 22 |
| 0.00% | 1.38% |
| - | - |
| 0.02 | 0.04 |
| 26.83 | 15.25 |
| 2.18 | 2.02 |
| 5.16 | 3.71 |
| 31.85 | 15.37 |
| 36.04 | 19.40 |
| 4.34 | 3.16 |
| 2.60% | 5.12% |
| 0.29 | 0.56 |
| 1.87 | 9.19 |
| - | - |
| 20.26% | 7.79% |
| 21.14% | 9.46% |
| 19.14% | 7.23% |
| 9.00% | 7.81% |
| 2.83 | 1.19 |
| 22.70% | 37.83% |
| 6.38% | 12.75% |
| 11.10% | 17.16% |
| 0.57 | 0.53 |
| 9.92% | 5.26% |
| - | - |
| -0.51% | 0.00% |
| -2.35% | 0.85% |
| -5.71% | 0.21% |
| 21.63% | 4.51% |
| 70.36% | 14.70% |
| 383,789 | 3,075,938 |
| 0.00% | 0.00% |
| 0.00% | 0.00% |
| 0.00% | 0.32% |
| 0.00% | 0.00% |
| HEI | HEI.A | MOG.A |
|---|---|---|
| 44.93 B | 34.42 B | 10.21 B |
| 6 | 1 | 3 |
| 0.07% | 0.10% | 0.36% |
| 0.00 | 0.01 | 0.01 |
| 38.44 | 29.82 | 22.90 |
| 3.56 | NA | NA |
| 10.26 | 7.86 | 4.94 |
| 50.68 | 38.82 | 26.63 |
| 58.72 | 44.91 | 31.69 |
| 10.02 | 7.67 | 2.52 |
| 1.70% | 2.23% | 3.16% |
| 0.49 | 0.49 | 0.51 |
| 6.36 | 6.36 | 12.08 |
| 21.32% | 21.32% | 17.97% |
| 12.05% | 12.24% | 16.80% |
| 28.58% | 28.58% | 9.79% |
| 17.10% | 17.10% | 9.44% |
| 2.83 | 2.83 | 2.33 |
| 37.54% | 37.54% | 33.75% |
| 15.39% | 15.39% | 6.38% |
| 16.80% | 16.80% | 15.47% |
| 0.54 | 0.54 | 0.92 |
| 10.91% | 11.47% | 7.49% |
| -0.30% | -0.36% | -0.43% |
| -0.64% | -0.95% | -0.11% |
| -8.48% | -9.00% | 12.91% |
| 4.85% | 2.57% | 62.93% |
| 41.85% | 34.94% | 71.10% |
| 411,693 | 263,259 | 238,002 |
| 0.00% | 0.00% | 0.00% |
| 2.17% | 0.00% | 3.19% |
| 3.36% | NA | 5.82% |
| 0.00% | 0.00% | -0.35% |
Zacks Stock Rating System
We offer two rating systems that take into account investors' holding horizons; Zacks Rank and Zacks Recommendation. Each provides valuable insights into the future profitability of the stock and can be used separately or in combination with each other depending on your investment style.
Zacks Recommendation
This rating system that has an excellent track record of predicting performance over the next 6 to 12 months. The foundation for the quantitatively determined Zacks Recommendation is trends in the company's estimate revisions and earnings outlook.
The Zacks Recommendation is broken down into 3 Levels; Outperform, Neutral and Underperform. Unlike most Wall Street firms, we have an excellent balance between the number of Outperform and Neutral recommendations.
Our team of 70 analysts are fully versed in the benefits of earnings estimate revisions and how that is harnessed through the Zacks quantitative rating system. But we have given our analysts the ability to override the Zacks Recommendation for the 1200 stocks that they follow. The reason for the analyst over-rides is that there are often factors such as valuation, industry conditions and management effectiveness that a trained investment professional can spot better than a quantitative model.
Zacks Rank
The Zacks Rank is our short-term rating system that is most effective over the one- to three-month holding horizon. The underlying driver for the quantitatively-determined Zacks Rank is the same as the Zacks Recommendation, and reflects trends in earnings estimate revisions.
| Value Score |
|
| Growth Score |
|
| Momentum Score |
|
| VGM Score |
|
Zacks Style Score Education
The Zacks Style Score is as a complementary indicator to the Zacks Rank, giving investors a way to focus on the best Zacks Rank stocks that best fit their own stock picking preferences.
Academic research has proven that stocks with the best Growth, Value, and Momentum characteristics outperform the market. The Zacks Style Scores rate stocks on each of these individual styles and assigns a rating of A, B, C, D and F. An A, is better than a B; a B is better than a C; and so on.
As an investor, you want to buy stocks with the highest probability of success. That means buying stocks with a Zacks Rank #1 or #2, Strong Buy or Buy, which also has a Style Score of an A or a B.
Disclosures
This report contains independent commentary to be used for informational purposes only. The analysts contributing to this report do not hold any shares of this stock. The analysts contributing to this report do not serve on the board of the company that issued this stock. The EPS and revenue forecasts are the Zacks Consensus estimates, unless otherwise indicated in the report’s first-page footnote. Additionally, the analysts contributing to this report certify that the views expressed herein accurately reflect the analysts' personal views as to the subject securities and issuers. ZIR certifies that no part of the analysts' compensation was, is, or will be, directly or indirectly, related to the specific recommendation or views expressed by the analyst in the report.
Additional information on the securities mentioned in this report is available upon request. This report is based on data obtained from sources we believe to be reliable, but is not guaranteed as to accuracy and does not purport to be complete. Any opinions expressed herein are subject to change.
ZIR is not an investment advisor and the report should not be construed as advice designed to meet the particular investment needs of any investor. Prior to making any investment decision, you are advised to consult with your broker, investment advisor, or other appropriate tax or financial professional to determine the suitability of any investment. This report and others like it are published regularly and not in response to episodic market activity or events affecting the securities industry.
This report is not to be construed as an offer or the solicitation of an offer to buy or sell the securities herein mentioned. ZIR or its officers, employees or customers may have a position long or short in the securities mentioned and buy or sell the securities from time to time. ZIR is not a broker-dealer. ZIR may enter into arms-length agreements with broker-dealers to provide this research to their clients. Zacks and its staff are not involved in investment banking activities for the stock issuer covered in this report.
ZIR uses the following rating system for the securities it covers. Outperform- ZIR expects that the subject company will outperform the broader U.S. equities markets over the next six to twelve months. Neutral- ZIR expects that the company will perform in line with the broader U.S. equities markets over the next six to twelve months. Underperform- ZIR expects the company will underperform the broader U.S. equities markets over the next six to twelve months.
No part of this report can be reprinted, republished or transmitted electronically without the prior written authorization of ZIR.